Exploratory Data Analysis
This analysis examines the bank marketing dataset to understand customer characteristics and factors influencing term deposit subscriptions.
Notebook Source
All visualizations and analysis results presented in this documentation are generated directly from the Jupyter notebook located at notebooks/01_exploratory_data_analysis.ipynb. The images are automatically saved to the documentation images folder during notebook execution, ensuring that the documentation always reflects the most current analysis results.
Raw Data Analysis
This exploratory analysis examines the raw, untransformed data to understand the initial distributions and characteristics. No data preprocessing, feature scaling, encoding, or transformations have been applied at this stage. The purpose is to analyze the data in its original form to identify patterns, outliers, and data quality issues that will inform subsequent preprocessing decisions.
Dataset Overview
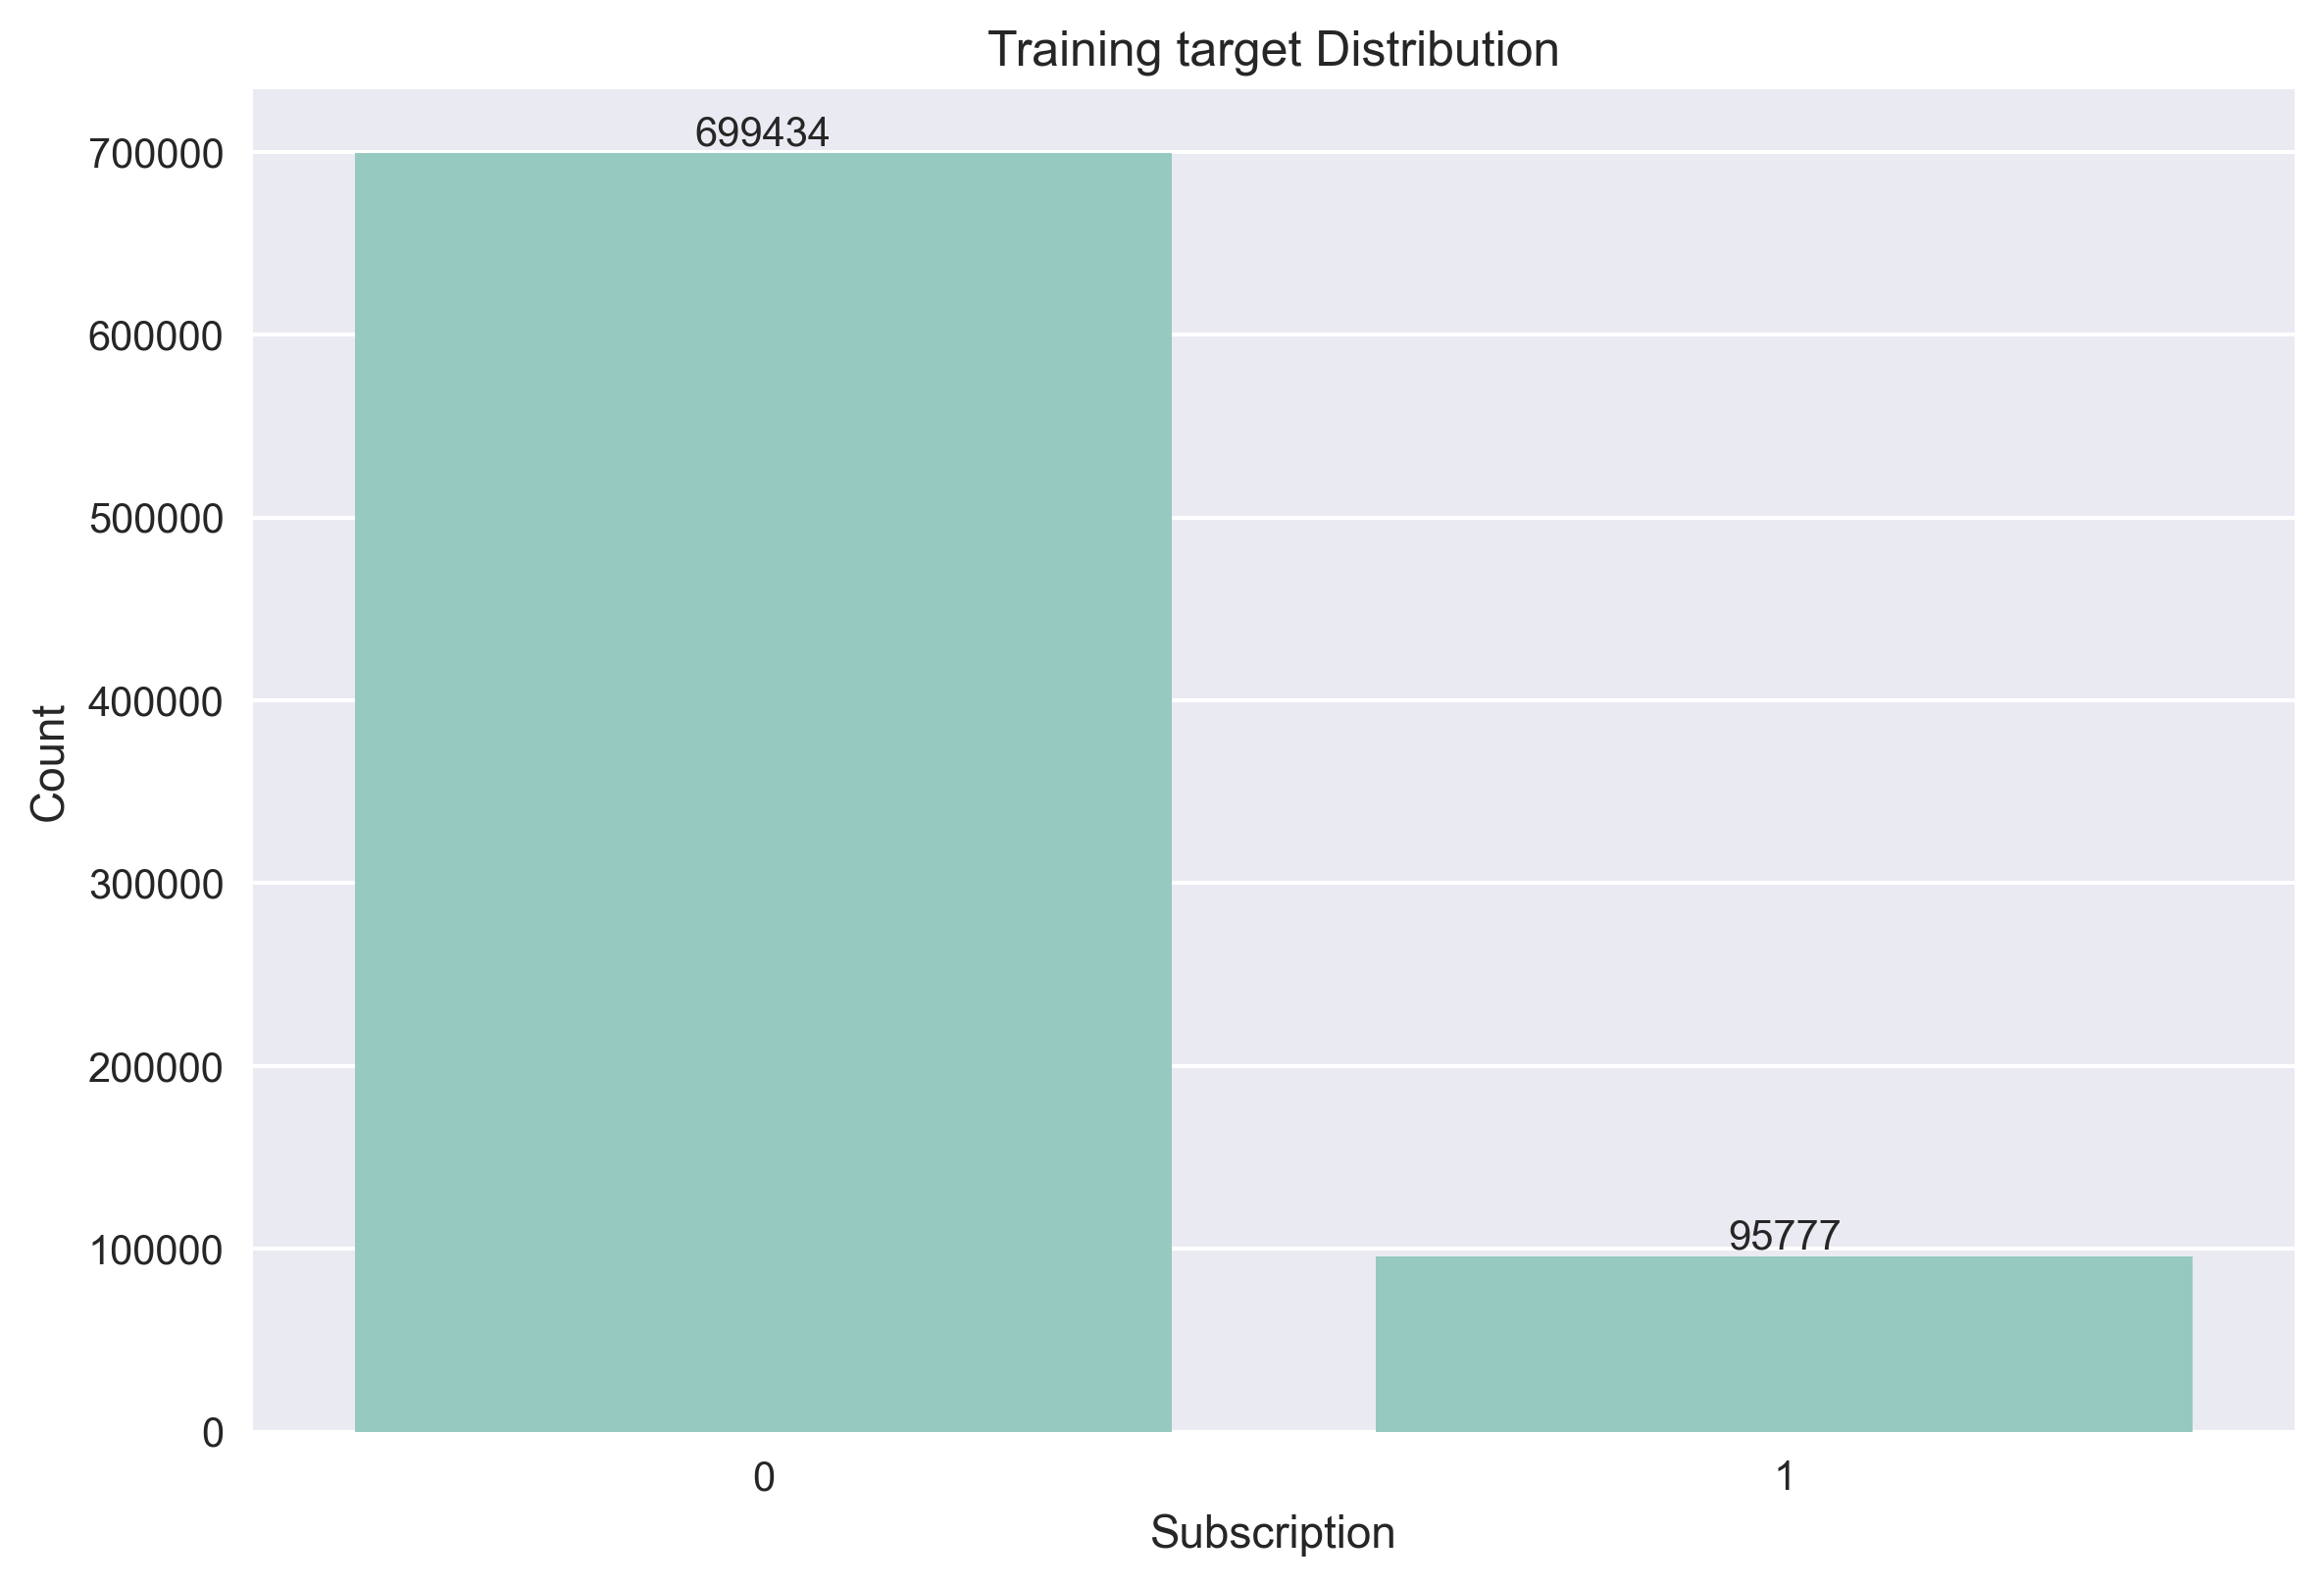
The training dataset contains 750,000 records with 17 features. Initial inspection reveals clean data with no missing values and without duplicates, which simplifies preprocessing. The target variable shows significant class imbalance - only 12.1% of customers subscribed to term deposits.
The imbalance ratio of 7.3:1 will need consideration during model training. SMOTE Technic can improve the data to generate more data on the minority class
Feature Analysis
Categorical Feature Distributions
The dataset contains nine categorical features covering customer demographics, financial products, and campaign characteristics.
Management roles represent the largest customer segment (23.5%), followed by blue-collar workers and technicians. Most customers are married (61.0%) with secondary education (51.3%).
Credit defaults are extremely rare (only 0.7%), while housing loans are common (56.2%) and personal loans less frequent (16.2%).
Most contacts are made via cellular (65.3%), with May being the most active campaign month (33.1%). Previous campaign outcomes are mostly unknown (81.8%).
Subscription Rates by Category
Students show the highest subscription rate at 34.1%, followed by retired customers at 30.8%. This suggests that customers with more flexible schedules may be more receptive to term deposit offers.
Financial product holdings show minimal impact on subscription rates, with slight variations across housing and loan status.
March campaigns achieved remarkable success rates of 57.1%, while August showed only 4.7% conversion. Previous successful campaigns strongly predict future subscriptions (76.4% success rate).
Numerical Feature Distributions
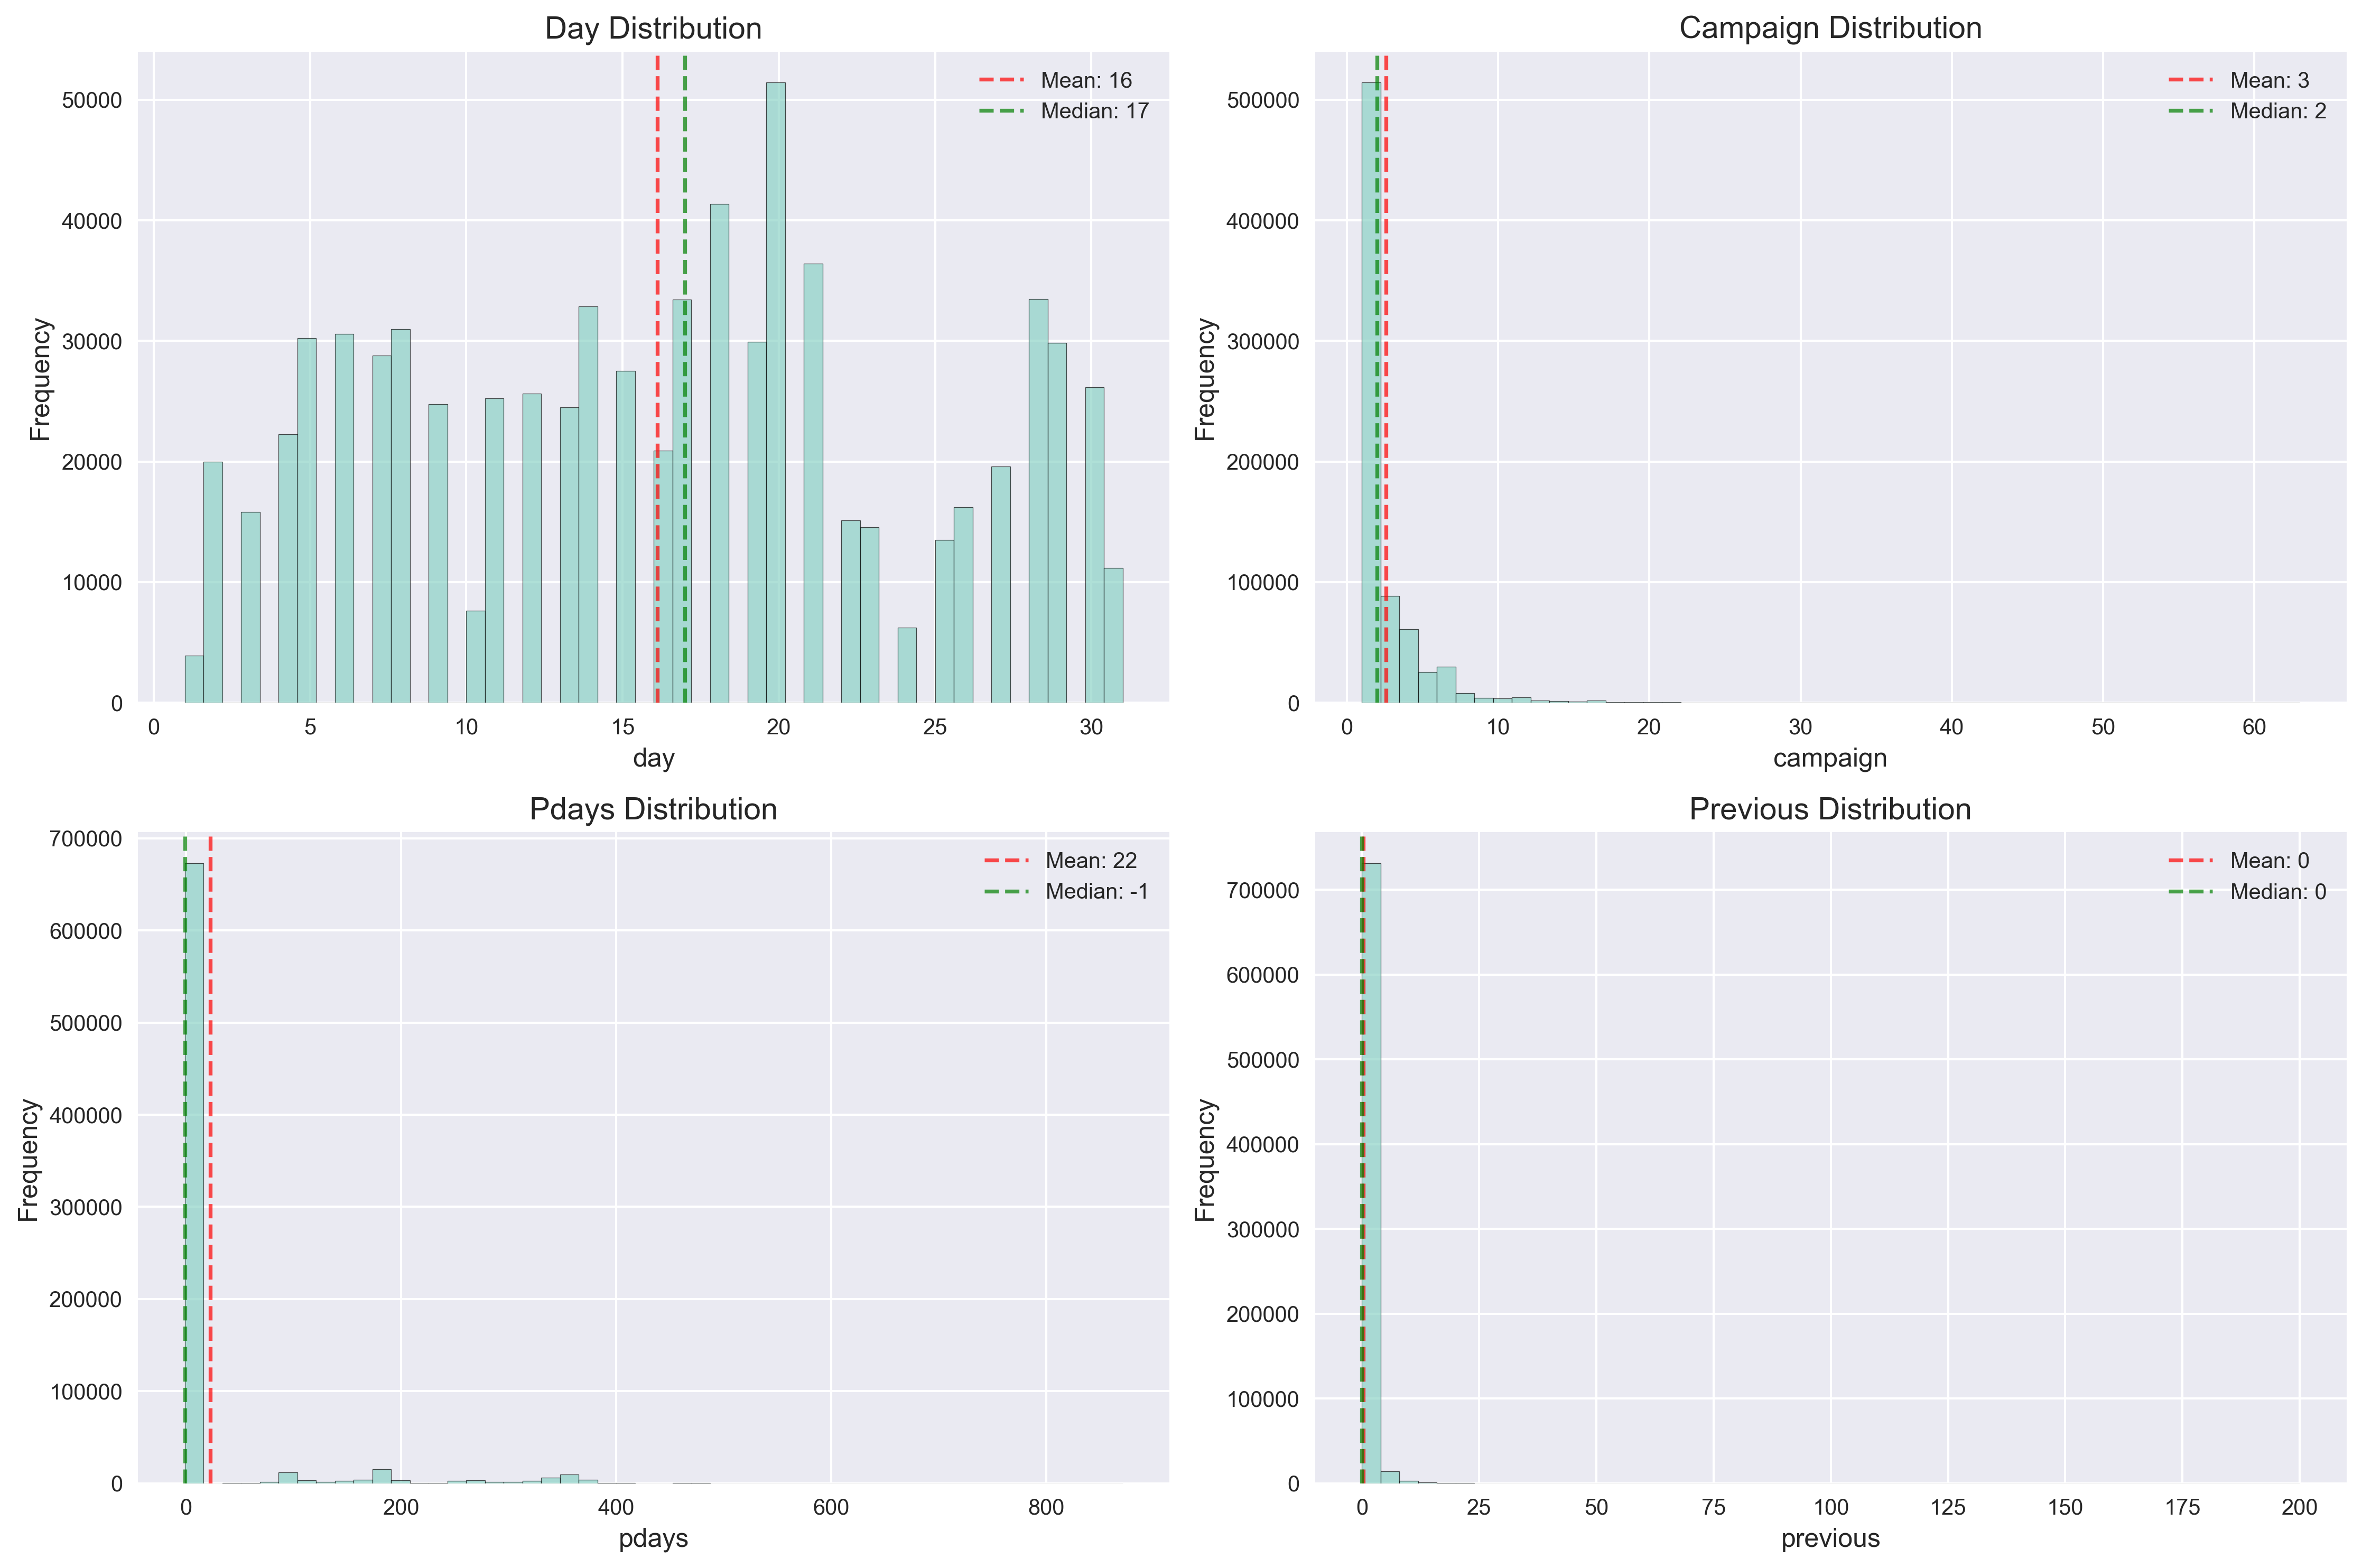
The dataset contains seven numerical features covering customer demographics, financial characteristics, and campaign metrics.
Customer demographics and engagement: Ages range from 18-95 with mean of 41 years. Account balances vary widely (-8,019 to 99,717) with median of 634, indicating modest balances for most customers. Call duration shows right-skewed distribution with mean of 256 seconds.
Campaign characteristics: Contact day shows uniform distribution (1-31). Most customers receive 2-3 campaign contacts. The pdays feature has many -1 values (indicating no previous contact), while previous contacts are typically zero or low values.
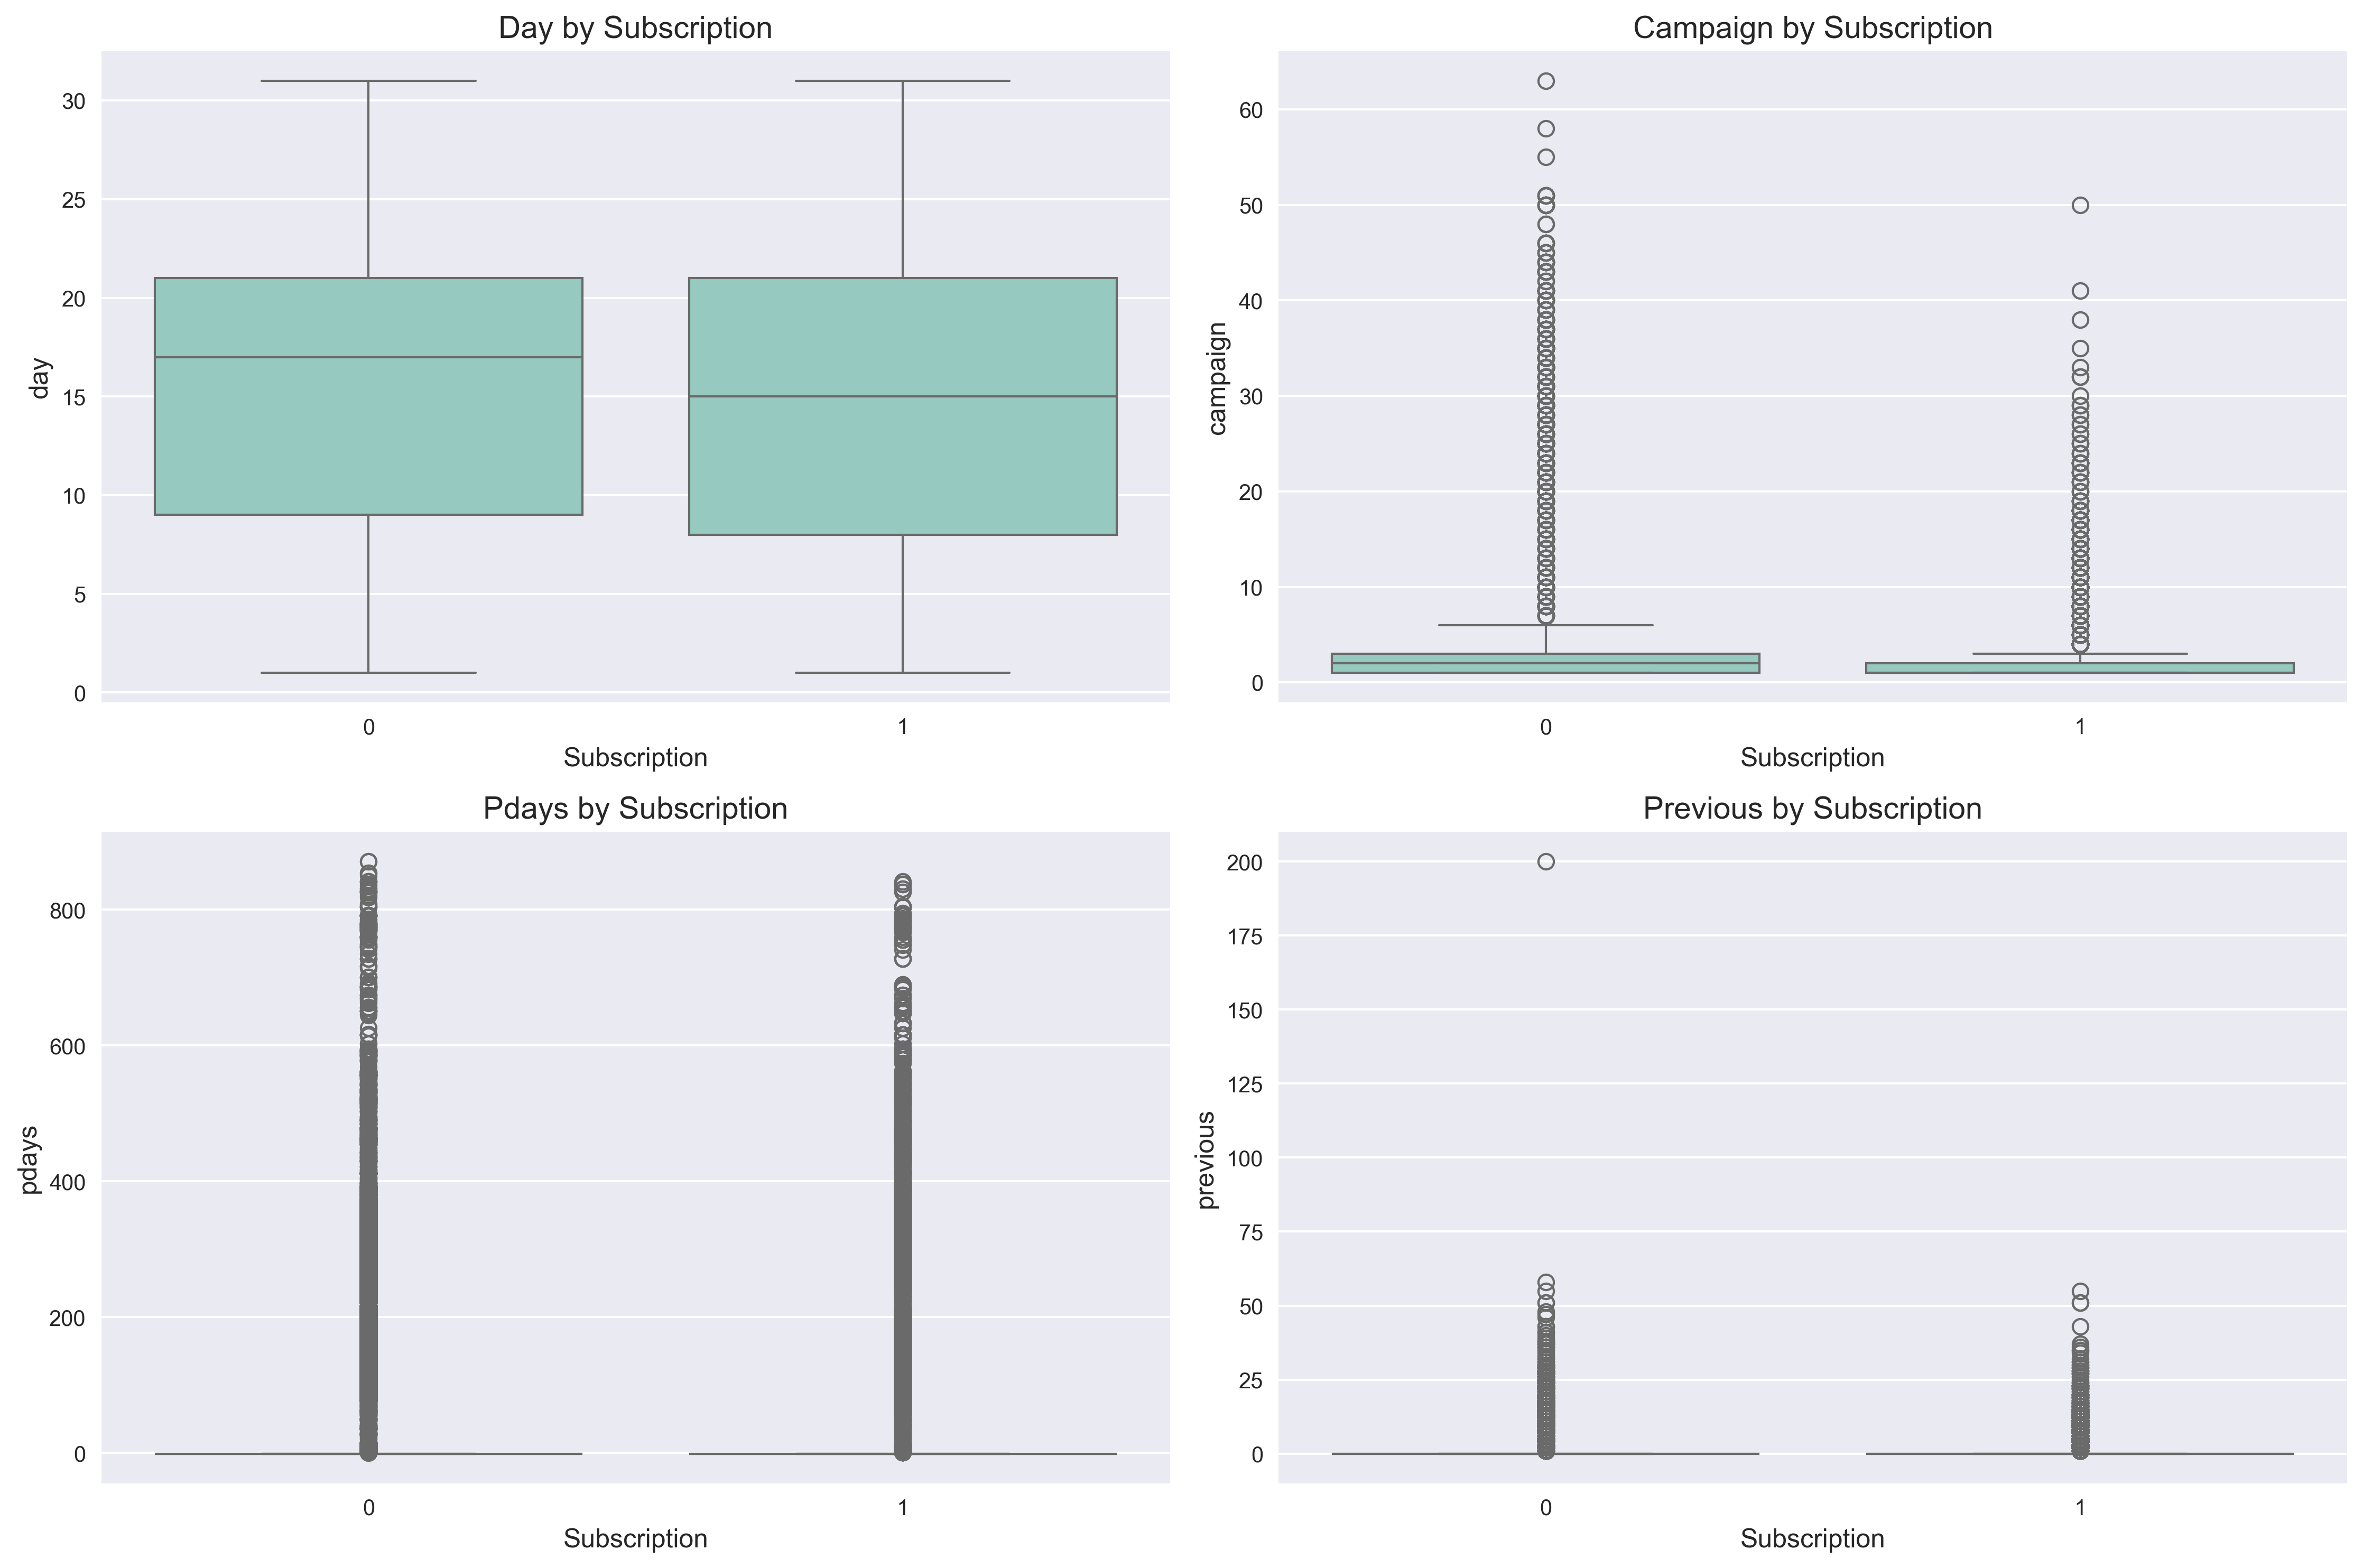
Numerical Features vs Target
Call duration emerges as the strongest predictor. Subscribers average 525 seconds per call compared to 212 seconds for non-subscribers. This engagement metric serves as an early success indicator during campaigns. Age and balance show minimal differences between subscription groups.
Campaign frequency shows diminishing returns beyond moderate contact levels (2-3 attempts optimal). The pdays and previous features reveal that customers with prior successful campaigns demonstrate significantly higher subscription rates.
Feature Correlations
Duration shows the strongest correlation with the target, while the rest of the features display very low correlation.
Key Findings
The analysis highlights several important patterns that can guide both campaign strategy and model design.
Call duration stands out as the most influential predictor (r = 0.519). On average, subscribers stay on the call for 525 seconds, compared to 212 seconds for non-subscribers. This makes it a strong early indicator of potential success during a campaign.
Customer segments display clear differences in conversion rates. Students (34.1%) and retirees (30.8%) show the highest engagement, likely due to greater schedule flexibility and a stronger focus on financial planning. In contrast, working professionals convert at more modest rates.
Seasonality plays a key role in outcomes. March campaigns reach a 57.1% success rate, while August drops sharply to 4.7%, suggesting there are optimal windows that align with economic cycles and consumer readiness.
Previous positive interactions are strong predictors of future subscriptions. Customers who responded successfully in past campaigns have a 76.4% conversion rate, underscoring the importance of maintaining relationships in financial services.
Contact frequency shows diminishing returns. Results suggest 2–3 contact attempts as the sweet spot, with more frequent outreach reducing effectiveness and potentially harming the customer relationship.
Finally, the 7.3:1 class imbalance mirrors real-world business conditions but requires careful handling in model development. These insights reveal important patterns around engagement duration, demographic-seasonal trends, and relationship history that inform model development.


